KipOff

Increasing Patient Engagement in Healthcare

Healthcare

Client
Regional Hospice
Industry
Healthcare
Country
USA FlagUSA
Team Size
Growth-stage

About Project

  • Website Design
  • Backend
  • Frontend
  • Web Development
  • MVP
Duration: 5 months
Healthcare providers across the U.S. face similar issues: visibility gaps, inconsistent communication, and low patient engagement. Based on 2024 data, over 46% of patients now research providers online before making an appointment, and 42% of patients say reviews online impact their choice. Yet, many practices struggle with visibility, communication inefficiencies, and building trust. These pain points often result in no-shows, slower coordination, and lost patient opportunities.
Project image 1
Project image 2
Project overview

The Challenge

One regional hospice and hospital network experienced exactly these recurring issues and decided to partner with KipOff. Internally, delays in coordination between doctors, nurses, and administrators were affecting patient care flow. Externally, low search visibility and minimal digital engagement made it difficult for new patients and families to find the hospice online. These gaps collectively resulted in a 12-15% no-show rate and slow referral response times.

Our Approach

To address these challenges, KipOff implemented a dual strategy, which included launching a Custom Medical Management App with real-time scheduling, secure messaging platform, and analytics dashboard for medication tracking. We also launched a targeted marketing campaign designed for patient trust and visibility including local SEO, paid Google Ads, educational content, and email automation.

STEP ONEicon

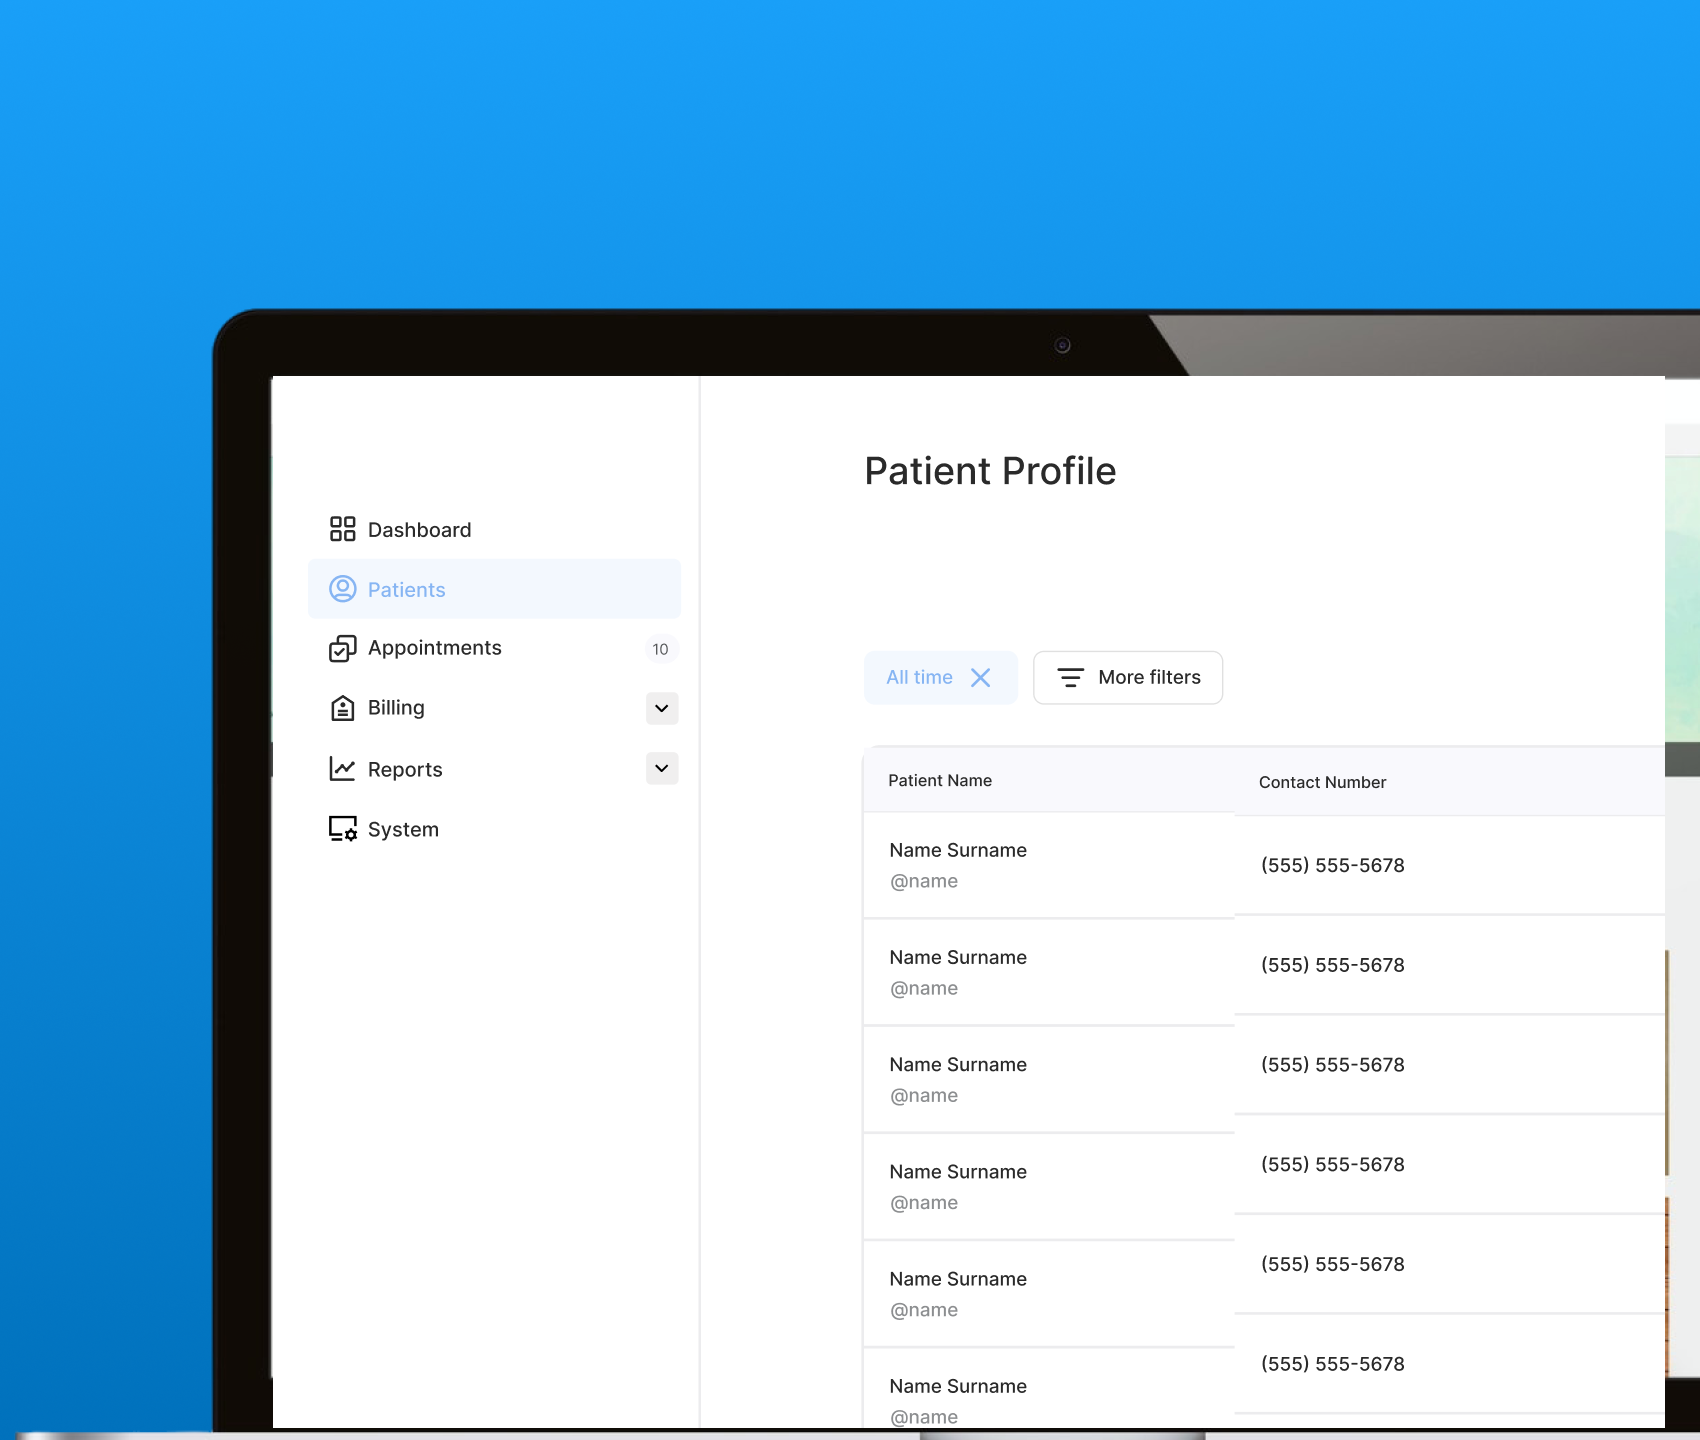
Real-time Scheduling Option

Having a real-time scheduling and notifications option helped keep track of the patients scheduling an appointment right away. In general, apps with scheduling and reminder options increase repeat bookings by ~30%.

STEP TWOicon

Secure Messaging Platform

We used a HIPAA-compliant internal messaging tool for staff and patient communication. This allowed quicker communication between them.
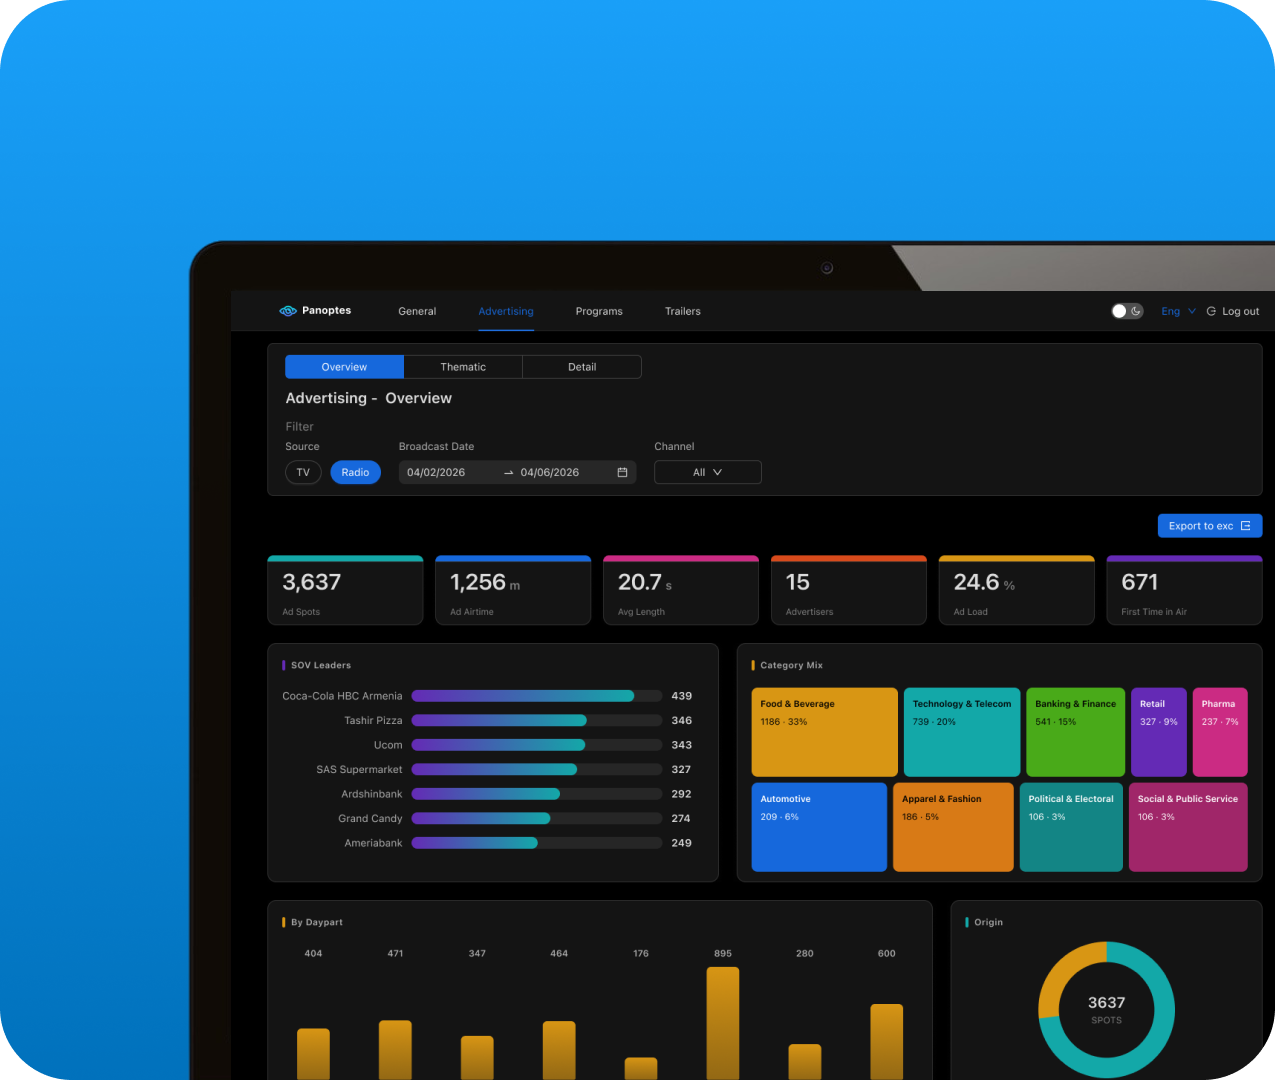
STEP THREEicon

Dashboard for Analytics and Medication Tracking

Analytics dashboards for administrators gave admins insights to improve efficiency. At the same time, treatment and medication tracking helped staff deliver consistent, reliable patient care.

Key Results

24% reduction in
wait times

Patient wait times reduced by 24%. It went down from 68 minutes to 52 minutes.

32% increase in
engagement

The educational content, like blogs, videos, and FAQs, led to longer on-page engagement and increased average session duration by 32%. From 1 minute 8 seconds, it increased to 1 minute 29 seconds.

34% more monthly
bookings

There were 34% more monthly online appointment bookings. It increased from 190 to 255. Also, the local website traffic grew by 22%, thanks to our SEO tactics.

86% patient
satisfaction

We conducted a survey and figured out that the patient satisfaction rate increased by 12 points. It increased from 74% to 86%.

Other Projects